
Financial Planning


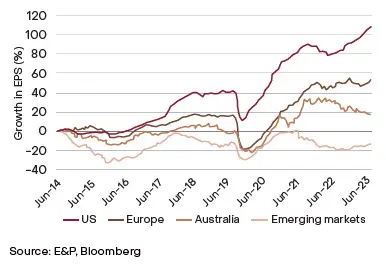
US equity markets have been clear outperformers in recent years, thanks to technological behemoths such as Apple, Alphabet, Microsoft and Meta. This has accelerated in recent quarters thanks to the contributions of Nvidia and the mania associated with the adoption of AI. Importantly though, returns have been driven by earnings upgrades, rather than just expanding valuations. In fact, over the last 10 years US companies have grown underlying earnings by 2x more than European companies, and more than 5x more than Australian companies.
US Earnings Dominance
Growth in underlying earnings per share (EPS), 10-years
Global Equities: Composition of Returns
Source of total return (EPS & PE ratio change), last 12-months
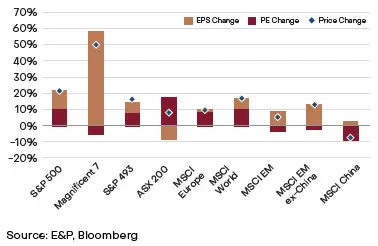
It’s difficult to see this trend reversing in the near-term. The US’ sector composition, the health of corporate and household balance sheets, and the expansionary fiscal policy backdrop (irrespective of the upcoming election result) should all be supporting factors for equity returns. Instead though, we would expect to see a broadening out of performance, with industries that have been in earnings recessions (such as healthcare, industrials and materials) playing catch-up. Small and mid-cap companies also looked well-placed with attractive valuation levels and solid earnings growth prospects. The threat of ‘higher for longer’ interest rates will put pressure on balance sheets and unprofitable business models, so we think it is imperative that investors adopt a quality bias when allocating to the space.
Mega & Small-Caps Valuations: Ratio
Ratio of S&P 100 and S&P 600 P/E
An upturn in the global economy should also support this. It now looks like European growth has troughed and monetary policy is becoming more supportive. The Chinese economy also looks to be at a turning point with consumer confidence and consumption measures bouncing off depressed levels. Other emerging market countries such as India, Mexico and Indonesia are also benefitting from US-China decoupling and the diversification of global supply chains. This is creating an abundance of opportunities for skilled investors.
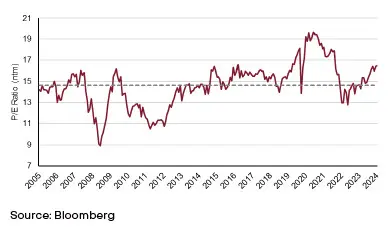
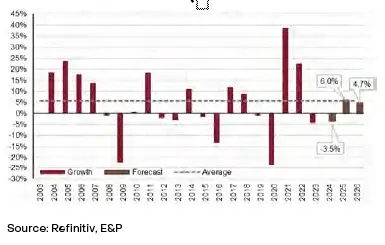
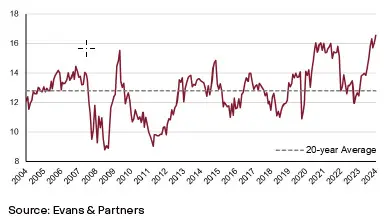
The domestic stock market continues to lag behind its developed market peers, a pattern we expect to persist over the medium-term. The S&P/ASX 200 is currently trading on a forward P/E ratio of 16.5x which is about 13% higher than its long-term average. This may look reasonable in a global context (particularly compared to the US), however we remain unenthused when considering the market’s benign earnings outlook (2% compound annual growth over the next 3 years). This is largely due to our market’s ‘mature’ business profile, whereby many of the largest companies in the index are operating in established sectors or industries where organic growth opportunities are becoming harder and harder to come by.
S&P/ASX 200 Valuation P/E ratio (ntm) of S&P/ASX 200 Index
ASX 200 Earnings Growth
Year-on-year EPS growth per FY, current consensus forecast
The major banks (which account for 23% of the index) are a good example of this. Australian system credit growth is expected to average ~2.5% for the next few years, meaning the only avenue for banks to grow earnings beyond this is to aggressively cut costs. At the same time, the sector is trading at an eye-watering multiple with Commonwealth Bank of Australia (CBA) trading on a forward P/E ratio of 22x. By comparison, Alphabet (the parent company of Google) which is expected to growth earnings by 12% per annum over the next 3 years, trades on a P/E of 20x.
S&P/ASX 200 Banks: Price-to-Earnings
P/E Ratio (ntm)

This document was prepared by Evans and Partners Pty Ltd (ABN 85 125 338 785, AFSL 318075) (“Evans and Partners”). Evans and Partners is a wholly owned subsidiary of E&P Financial Group Limited (ABN 54 609 913 457) (E&P Financial Group) and related bodies corporate.
This communication is not intended to be a research report (as defined in ASIC Regulatory Guides 79 and 264). Any express or implicit opinion or recommendation about a named or readily identifiable investment product is merely a restatement, summary or extract of another research report that has already been broadly distributed. You may obtain a copy of the original research report from your adviser.
The information may contain general advice or is factual information and was prepared without taking into account your objectives, financial situation or needs. Before acting on any advice, you should consider whether the advice is appropriate to you. Seeking professional personal advice is always highly recommended. Where a particular financial product has been referred to, you should obtain a copy of the relevant product disclosure statement or other offer document before making any decision in relation to the financial product. Past performance is not a reliable indicator of future performance.
The information may contain statements, opinions, projections, forecasts and other material (forward looking statements), based on various assumptions. Those assumptions may or may not prove to be correct. Neither E&P Financial Group, its related entities, officers, employees, agents, advisers nor any other person make any representation as to the accuracy or likelihood of fulfilment of the forward looking statements or any of the assumptions upon which they are based. While the information provided is believed to be accurate E&P Financial Group takes no responsibility in reliance upon this information.
The information provided is correct at the time of writing or recording and is subject to change due to changes in legislation. The application and impact of laws can vary widely based on the specific facts involved. Given the changing nature of laws, rules and regulations, there may be delays, omissions or inaccuracies in information contained.
Any taxation information contained in this communication is a general statement and should only be used as a guide. It does not constitute taxation advice and before making any decisions, you should seek professional taxation advice on any taxation matters where applicable.
The Financial Services Guide of Evans and Partners contains important information about the services we offer, how we and our associates are paid, and any potential conflicts of interest that we may have. A copy of the Financial Services Guide can be found at www.eandp.com.au. Please let us know if you would like to receive a hard copy free of charge.

Fill out this expression of interest and you will be alerted when applications open later in the year.
Begin a conversation with an accountant who can help you with your self-managed super fund.
Begin a conversation with an adviser who will help you achieve your wealth goals.
Subscribe to get Insights and Ideas about trends shaping markets, industries and the economy delivered to your inbox.
Reach out and start a conversation with one of our experienced team.
Begin a conversation with one of our advisers who will help you achieve your wealth goals.
You can search for an adviser by location or name. Alternatively contact us and we will help you find an adviser to realise your goals.