






A pass on paper: Our grade on the Aussie reporting season
Roadmap
Read time 4mins
Back to Insight
Now Reading:
A pass on paper: Our grade on the Aussie reporting season
Four rate rises, a Budget that wound back tax concessions for property investors and an energy-driven lift in inflation – August’s reporting season was a test of how much pressure Australian companies could absorb. On the surface, they passed, with the broader market beating expectations, but on closer examination, growth is narrow, outlooks are cautious and boards are handing cash back rather than investing it.
Room for improvement
The bar had been lowered in the lead up with management teams cooling expectations during the May ‘confession season’. Realised profits grew 12.0% year-on-year, though this was heavily influenced by the booming materials sector. Stripping materials out, earnings grew by 4.6%, and analysts expect a similar split in FY27 (+8.9%, or +5.2% outside energy and mining).
Beats and misses were evenly split and aggregate earnings per share measures finished around 2% lower, yet some of the best share price reactions went to companies whose results were simply less bad than feared. CSL is the clearest example; after falling 22.6% in May, as healthcare became one of the most heavily de-rated sectors of FY26, it rose 17% on a result that beat expectations by just 2%. Reactions bore little relation to the size of the beat, so sentiment was doing more of the work than earnings.
The view from the boardroom
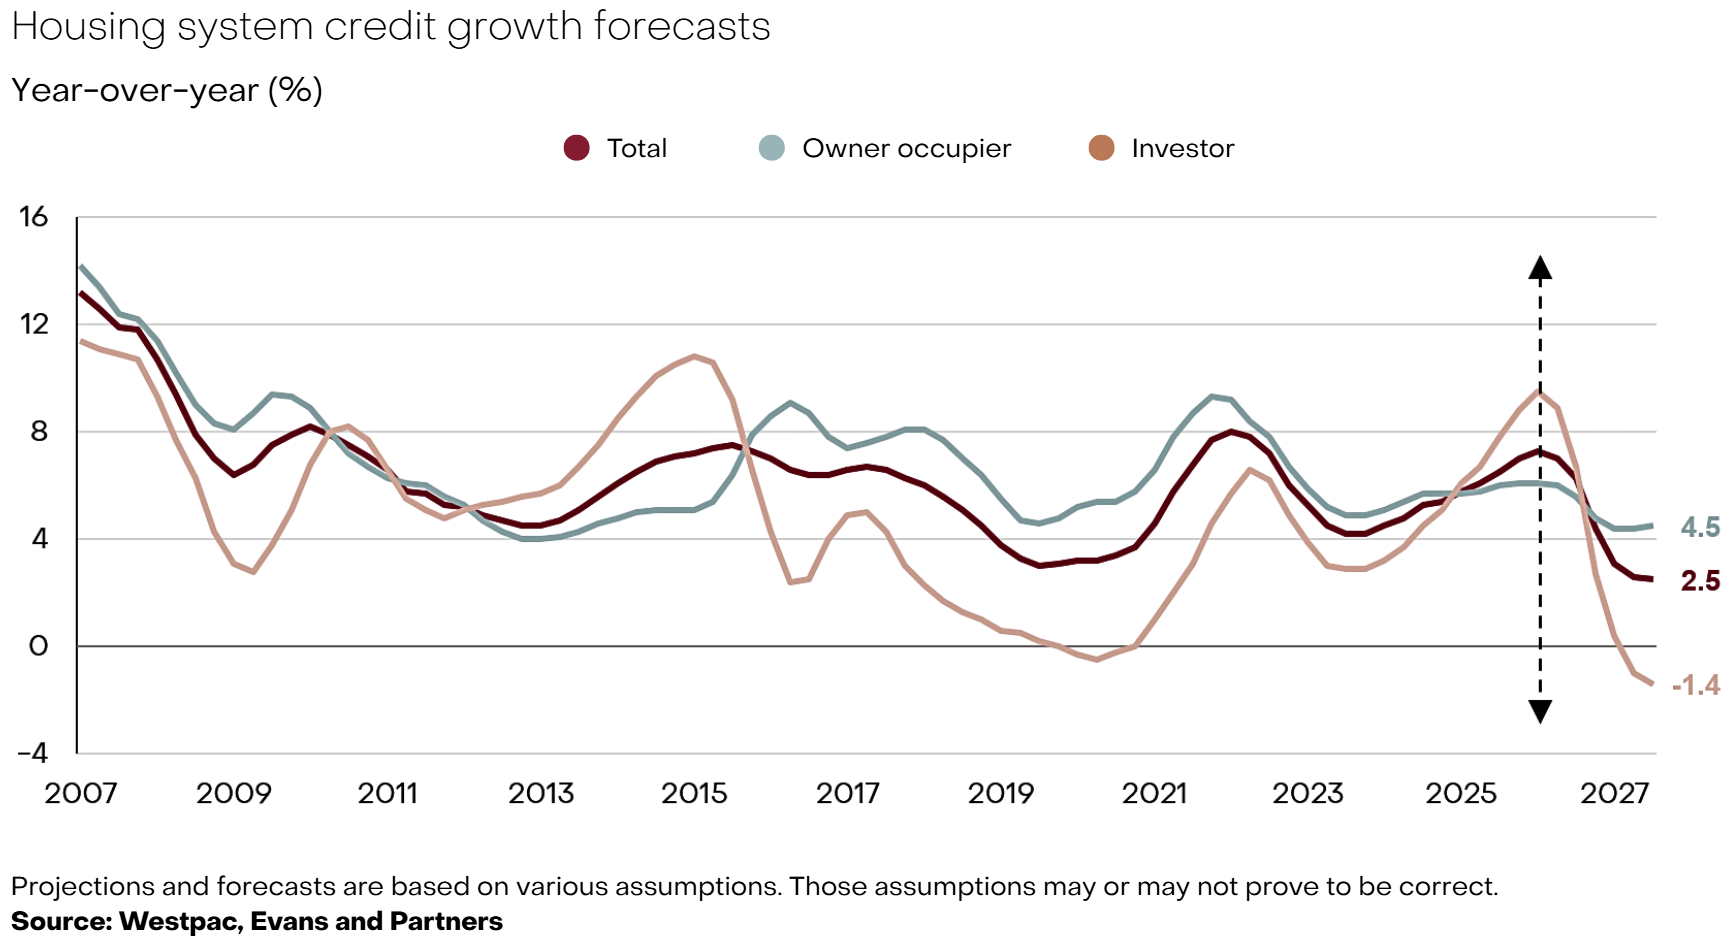
Beyond the numbers, company outlook statements arguably offered a more direct read on how the domestic economy was performing. Housing is where higher rates and changes to tax policy are biting hardest. All four major banks flagged slowing credit growth. Westpac reported mortgage applications down 20% between the May Budget and the end of July, and ANZ, CBA and NAB reported falls of 12% to 15%. House prices are following activity lower, with the five major capitals approximately 5% below their April peak, and we see scope for this downturn to exceed the roughly 8% falls of 2017-19 and 2022-23.
On the consumption front, households are trading down rather than cutting back, which the aggregate data isn’t built to capture. Consumer spending rose +0.4% in the June quarter, yet company results show where it went. Woolworths cut prices and lifted Australian Food sales 5.7% in the second half, JB Hi-Fi’s comparable sales turned negative 0.8% in the final quarter as customers moved to lower-specification product, and Nick Scali reported store traffic down 10% to 15%. What’s clear is that persistent inflation is eroding real purchasing power, and paired with higher mortgage repayments, it’s crimping household budgets.
Boards weighed the same conditions and chose to return cash rather than commit it. Two-thirds of companies lifted their dividend, the most since 2021, and the market rewarded them returning a median 5.5% on the day, against -1.6% for those running buybacks. A higher payout ratio leaves less for reinvestment, a strong signal that boards and management teams are finding few domestic opportunities worth funding.
September’s trading shows where investors see the risk. CBA (-5.6%), the largest mortgage lender, lagged the broader market as house prices kept falling, while the online classifieds sold off on the same domestic weakness: REA (-11.1%) on listing volumes, Seek (-16%) on rising unemployment and Carsales (-17.4%) on softening vehicle demand.
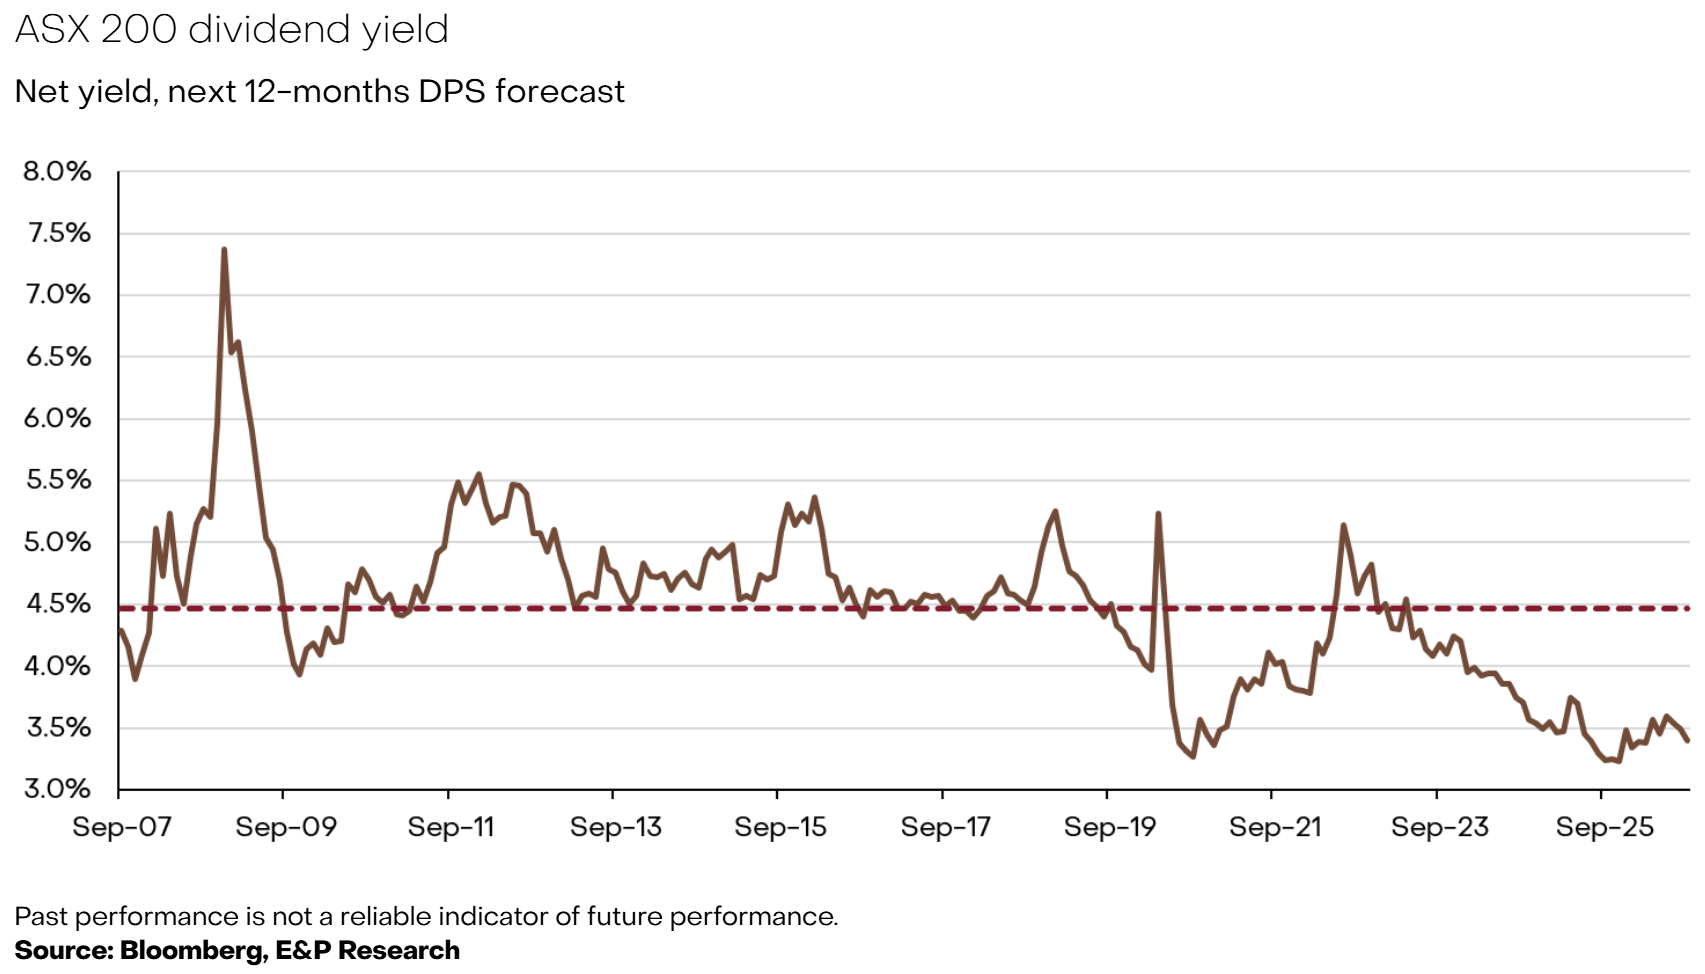
We read this as the market pricing a higher for longer interest rate regime, more intense housing downturn, a softer labour market and weaker consumer demand. Reality is that valuations also offer little cushion. At 18x forward earnings the market looks expensive against its growth outlook, while a net dividend yield of 3.5% sits at the very bottom of a 20-year historical range.
Disclaimer
This article was prepared by Evans and Partners Pty Ltd (ABN 85 125 338 785, AFSL 318075) (“Evans and Partners”). Evans and Partners is a wholly owned subsidiary of E&P Financial Group Limited (ABN 54 609 913 457) (E&P Financial Group) and related bodies corporate
The information may contain general advice or is factual information and was prepared without taking into account your objectives, financial situation or needs. Before acting on any advice, you should consider whether the advice is appropriate to you. Seeking professional personal advice is always highly recommended. Where a particular financial product has been referred to, you should obtain a copy of the relevant product disclosure statement or other offer document before making any decision in relation to the financial product. Past performance is not a reliable indicator of future performance.
The information may contain statements, opinions, projections, forecasts and other material (forward looking statements), based on various assumptions. Those assumptions may or may not prove to be correct. Neither E&P Financial Group, its related entities, officers, employees, agents, advisers nor any other person make any representation as to the accuracy or likelihood of fulfilment of the forward looking statements or any of the assumptions upon which they are based. While the information provided is believed to be accurate E&P Financial Group takes no responsibility in reliance upon this information.
The information provided is correct at the time of writing or recording and is subject to change due to changes in legislation. The application and impact of laws can vary widely based on the specific facts involved. Given the changing nature of laws, rules and regulations, there may be delays, omissions or inaccuracies in information contained.
Any taxation information contained in this communication is a general statement and should only be used as a guide. It does not constitute taxation advice and before making any decisions, you should seek professional taxation advice on any taxation matters where applicable.
The Financial Services Guide of Evans and Partners contains important information about the services we offer, how we and our associates are paid, and any potential conflicts of interest that we may have. A copy of the Financial Services Guide can be found at www.eandp.com.au. Please let us know if you would like to receive a hard copy free of charge.
Featured Insights
View all Insights

Financial Planning
CGT Changes from 1 July 2027: What the New Law Means
For the best part of three decades, the 50% CGT discount has been a fixture of Australian tax planning. From 1 July 2027, it's gone, replaced by a return to cost base indexation and a new 30% minimum tax on real capital gains.
Connect to an Adviser
Begin a conversation with an adviser who will help you achieve your wealth goals.
Internship Program - Expression of Interest
Fill out this expression of interest and you will be alerted when applications open later in the year.
Help me find an SMSF accountant
Begin a conversation with an accountant who can help you with your self-managed super fund.
Media Enquiry
Help me find an adviser
Begin a conversation with an adviser who will help you achieve your wealth goals.
Subscribe to insights
Subscribe to get Insights and Ideas about trends shaping markets, industries and the economy delivered to your inbox.
Start a conversation
Reach out and start a conversation with one of our experienced team.
Connect to adviser
Begin a conversation with one of our advisers who will help you achieve your wealth goals.
You can search for an adviser by location or name. Alternatively contact us and we will help you find an adviser to realise your goals.
Contact Peter Plakidis
Head of Natural Resources Group, Corporate Advisory
Contact Alex McLean
Director, Small Caps
Contact Abraham Akra
Director, Small Caps
Contact JP Brennan
Associate Director, Corporate Advisory
Contact Angus Twopeny
Managing Director - Head of Private Wealth Adelaide, Senior Investment Adviser
Contact Fergus Flanagan
Associate, Chief Investment Office
Contact Ashley Price
Analyst – Equity Research, Chief Investment Office
Contact Alice Frawley
Associate, Chief Investment Office
Contact Joshua Patience
Non-Executive Director
Contact Anji Carfrae
Associate, Corporate Access Specialist
Contact Adam Negri
Associate Director, Institutional Equities
Contact Michael De Palma
Associate Director, Institutional Equities
Contact Czarlette Cheika
Associate, Corporate Access
Contact Jack Carroll
Associate, Fixed Income
Contact Andrew Tanner
Senior Advisor, Institutional Equities
Contact Kevin Lu
Analyst, Corporate Advisory
Contact Mark Connors
Managing Director, Senior Investment Adviser and Head of Private Wealth Management, Brisbane
Contact Hibah Jamal
Investment Adviser
Contact Luke Fussell
Investment Adviser
Contact Giorgio Antoci
Associate, Research
Contact Hamish Whitehead
Managing Director, Co-Head of E&P Capital and Head of Capital Markets
Contact Adam Howard
Associate, Corporate Advisory
Contact Mike Adams
General Counsel & Joint Company Secretary
Contact Robert Darwell
Chief Financial Officer & Joint Company Secretary
Contact Shankari Thayakaran
Associate, Small Caps
Contact Miquela Bezuidenhoudt
Associate Director, Capital Markets
Contact Annabel Khun
Associate Director, Technology
Contact Richard Trinder
Analyst, Capital Markets
Contact Daniel Jetter
Executive Director, Fixed Income
Contact Entcho Raykovski
Managing Director, Media & Telco
Contact James Morrow
Managing Director - Head of Fund Research, Chief Investment Office
Contact Ben Keeble
CEO and Managing Director
Contact Tiana Moini
Corporate Access Coordinator
Contact Paris Gutierrez
Director – Senior Specialist, Corporate Access
Contact Tanya Irvine
Managing Director, Head of Corporate Access
Contact Taylor Duong
Associate Director, Institutional Middle Office
Contact Stefan Cvetkovic
Director, Fixed Income
Contact James O’Hare
Managing Director, Head of Fixed Income
Contact Simon Bernadou
Associate Director, Institutional DTR
Contact Mark Steer
Director, Sales Trader
Contact Alexander Blight
Executive Director, Sales Trader
Contact Adam Woods
Managing Director, Head of Sales Trading
Contact Anna Lenzner
Executive Director, Institutional Equities Sales
Contact Bill Forde
Executive Director, Institutional Equities Sales
Contact Will Hart
Managing Director - Head of Portfolio Management & Responsible Investment, Chief Investment Office
Contact Sam Fletcher
Managing Director, Institutional Equities Sales
Contact Anne Anderson
Independent Member, Investment Committee
Contact Honor McFadyen
Independent Chair, Investment Committee
Contact Natalie Virgona
Desktop Publisher, Corporate Advisory
Contact Buddhika Ratnasekara
Associate, Corporate Advisory
Contact Harshit Taneja
Associate, Corporate Advisory
Contact Stephanie Kelaher
Director, Corporate Advisory
Contact Andrew Serle
Managing Director, Co-Head of Corporate Advisory
Contact Nicholas Zaita
Executive Director, Corporate Advisory
Contact Tom Washington
Managing Director, Co-Head of Corporate Advisory
Contact Peter Jorgensen
Managing Director - Head of Private Wealth Sydney, Senior Investment Adviser
Contact Hannah Doherty-McMillan
Executive Director, Senior Investment & Strategy Adviser
Contact Andrew Moir
Managing Director, Senior Investment Adviser, Investment Committee Member, Product Review Group Chair
Contact Alex Rock
Managing Director, Co-Head of E&P Capital
Contact Olivia Cartwright
Director, Australian Institutional Sales
Contact Sam Bradshaw
Associate Director, Gaming & Leisure
Contact Harry Saunders
Director, Building Materials, Steel & Chemicals
Contact Max Casey
Head of Investment Strategy, Chief Investment Office
Contact David Nayagam
Executive Director, Healthcare
Contact Adam Martin
Executive Director, Energy
Contact Tim Rocks
Chief Investment Officer
Contact Robin Young
Executive Director – Equity and Fund Research, Chief Investment Office
Contact Olivier Coulon
Executive Director, Small Caps
Contact Phillip Kimber
Executive Director, Consumer
Contact Paul Mason
Managing Director, Technology
Contact Cameron McDonald
Managing Director, Head of Research
Contact Alex Maclachlan
Managing Director & CEO – E&P Funds
Contact Paul Ryan
Managing Director & CEO – E&P Wealth
Contact Ben Keeble
CEO and Managing Director
Contact Francis Araullo
Chief Risk Officer
Contact Josephine Linden
Independent Non-Executive Director
Contact Rose Clark
Chief People Officer
Contact Sally McCutchan
Independent Non-Executive Director
Contact Tony Johnson
Non-Executive Director
Contact David Evans
Non-Executive Chairman