

Roadmap


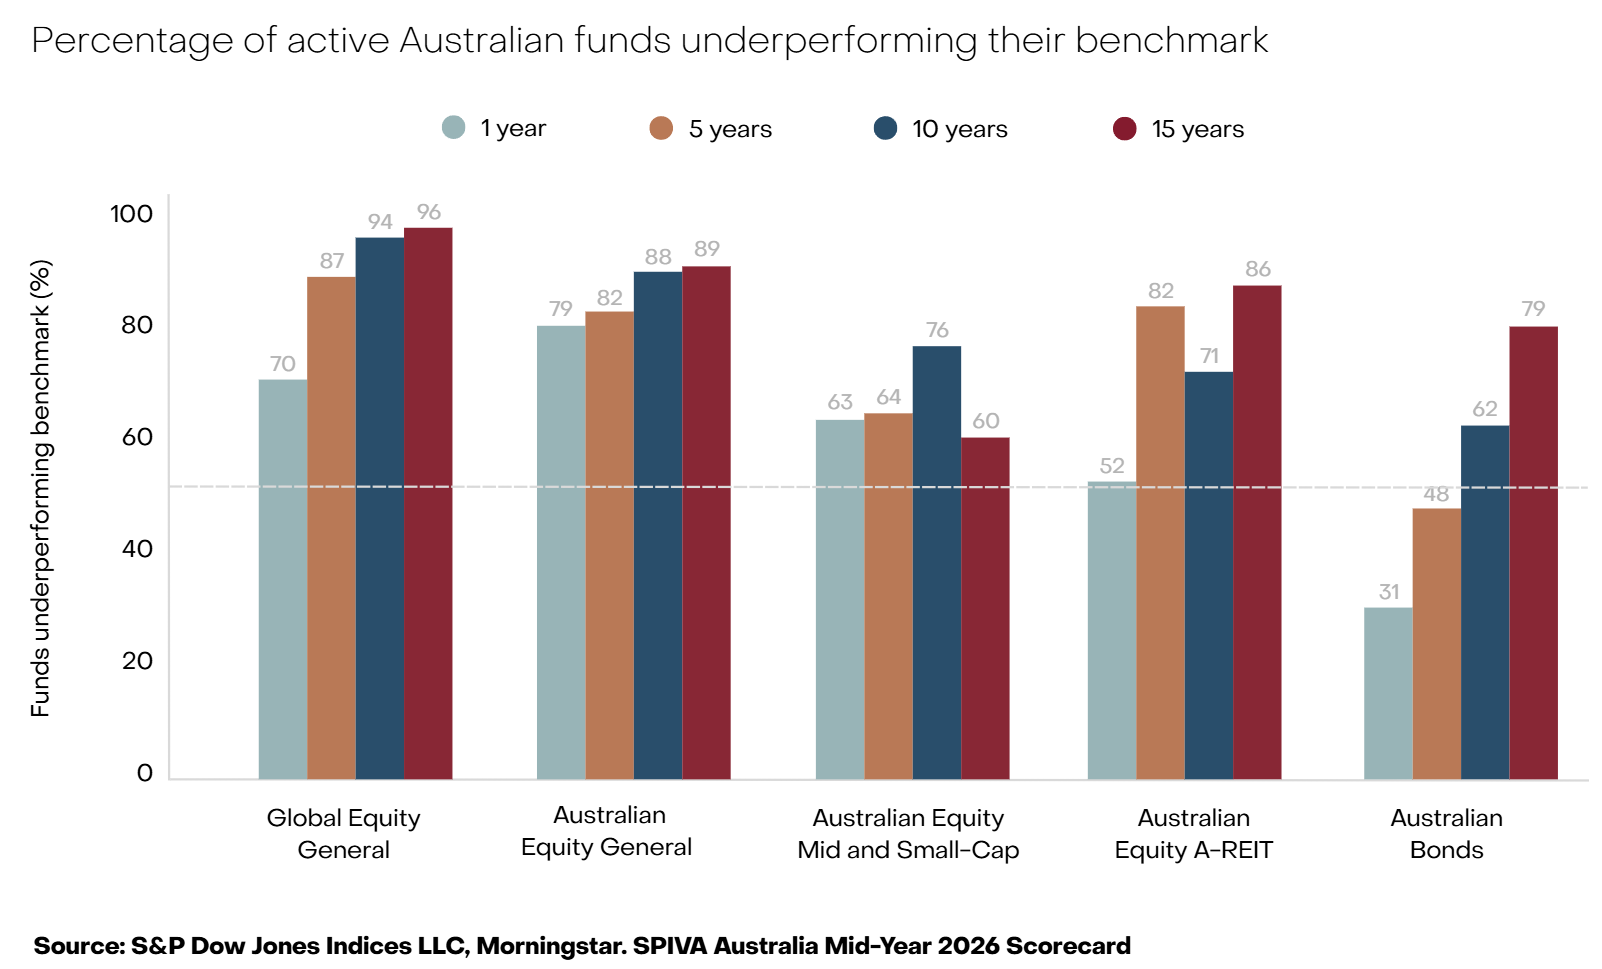
This is notable because conditions looked favourable for active managers. Dispersion, the spread of returns across individual stocks, rose sharply. Across developed markets it reached levels last seen during the Global Financial Crisis. Locally, sector returns ranged from double-digit gains in Materials and Energy to a 21.9% fall in Health Care. Yet market leadership was narrow. Only 35% of ASX 200 companies beat the index, and the weight of the top 20 stocks rose to 63.4%.
Several forces are at play. A few large companies (notably technology) have driven recent returns, and many active managers have held them below index weight. Quantitative trading has grown materially, closing mispricing quickly, while structural issues such as increases in passive flows and the introduction of the super performance test steer more capital towards index weights. Fees are the other key factor. Over ten years, the average active Australian share fund trailed the index by about 1.2 percentage points a year after fees. Add back a typical fee and that gap largely closes.
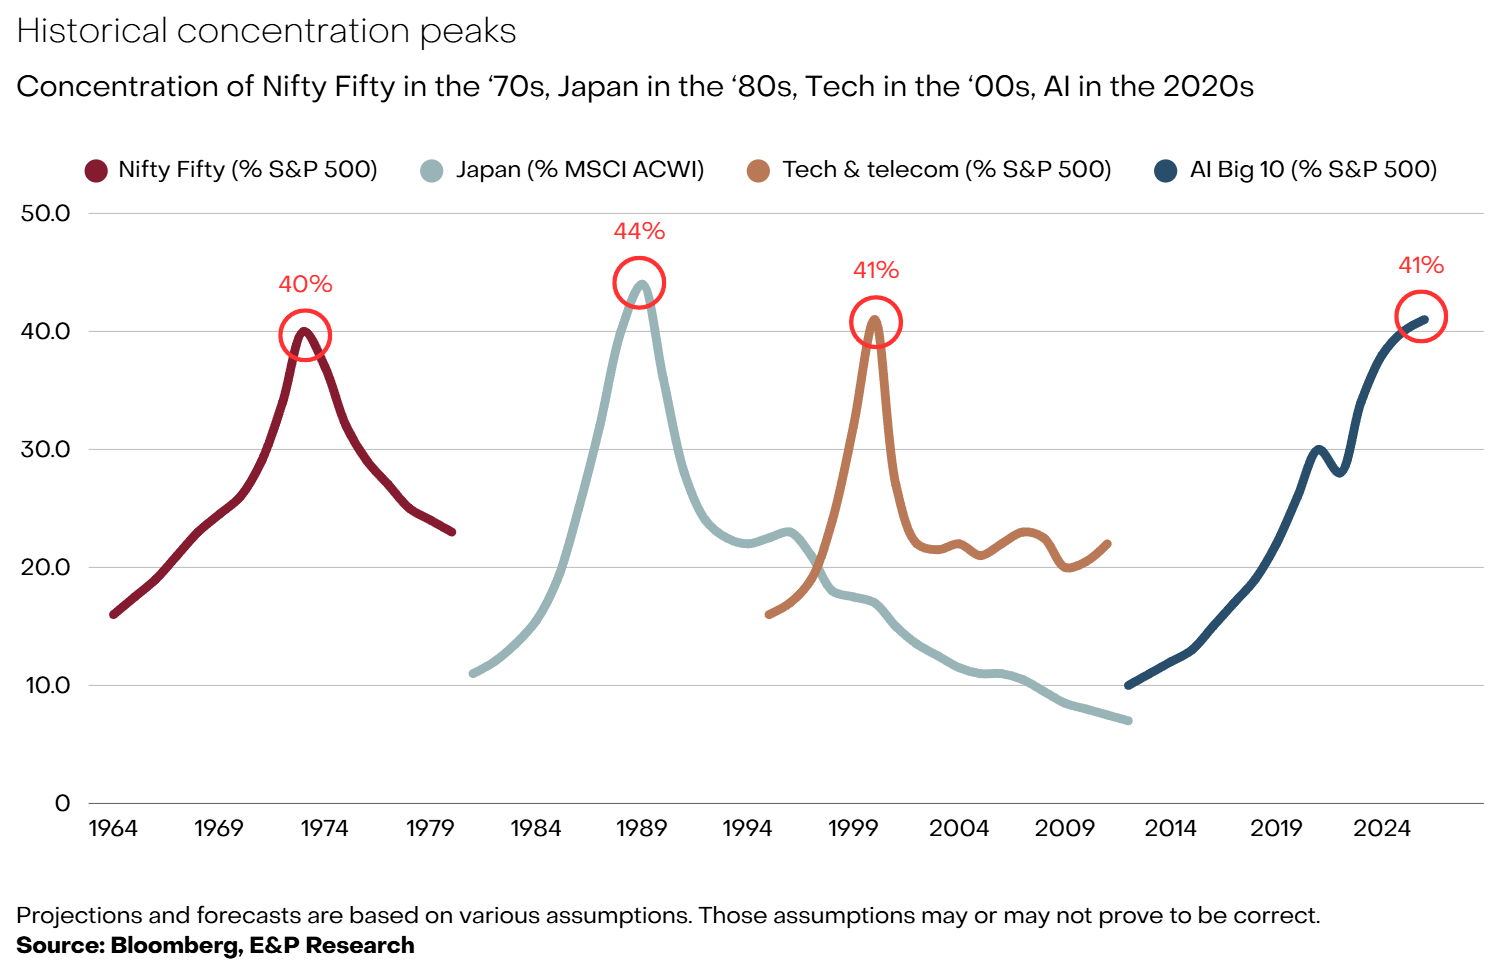
However, it is important to note that these trends can change. Concentration has peaked before. The Nifty Fifty in the 1970s, Japan in the late 1980s and technology stocks in 2000 each reached around 40% of their benchmark before falling away. The largest AI-linked companies sit at similar levels today. Locally, News Corp made up 15% of the All Ordinaries in early 2000, and five years later had left the local index altogether. At home, the major banks dominate just as rates have risen and house prices fall. An AI slowdown, an inflation shock or other unforeseen issues could all shift leadership.
Does this mean a return to active stock picking is imminent? High dispersion suggests the opportunity is there, but the long-run record suggests caution is warranted. With this in mind, we generally combine three investment approaches when building portfolios: passive, systematic and active. Passive funds track an index at low cost and suit the most efficient markets. Systematic funds follow set rules to favour certain traits and can adjust as market conditions shift, while keeping costs and tracking error low. Active managers make their own calls, and we use them where markets are less efficient or specialist expertise is needed.
Over the long term, we aim to add value through the markets we focus on, how we position as conditions change, and the managers we select. We won’t (and don’t) get every call right, but we want each of these areas to contribute through time. That, not a fixed view on active or passive, is what getting the balance right means to us.
This article was prepared by Evans and Partners Pty Ltd (ABN 85 125 338 785, AFSL 318075) (“Evans and Partners”). Evans and Partners is a wholly owned subsidiary of E&P Financial Group Limited (ABN 54 609 913 457) (E&P Financial Group) and related bodies corporate
The information may contain general advice or is factual information and was prepared without taking into account your objectives, financial situation or needs. Before acting on any advice, you should consider whether the advice is appropriate to you. Seeking professional personal advice is always highly recommended. Where a particular financial product has been referred to, you should obtain a copy of the relevant product disclosure statement or other offer document before making any decision in relation to the financial product. Past performance is not a reliable indicator of future performance.
The information may contain statements, opinions, projections, forecasts and other material (forward looking statements), based on various assumptions. Those assumptions may or may not prove to be correct. Neither E&P Financial Group, its related entities, officers, employees, agents, advisers nor any other person make any representation as to the accuracy or likelihood of fulfilment of the forward looking statements or any of the assumptions upon which they are based. While the information provided is believed to be accurate E&P Financial Group takes no responsibility in reliance upon this information.
The information provided is correct at the time of writing or recording and is subject to change due to changes in legislation. The application and impact of laws can vary widely based on the specific facts involved. Given the changing nature of laws, rules and regulations, there may be delays, omissions or inaccuracies in information contained.
Any taxation information contained in this communication is a general statement and should only be used as a guide. It does not constitute taxation advice and before making any decisions, you should seek professional taxation advice on any taxation matters where applicable.
The Financial Services Guide of Evans and Partners contains important information about the services we offer, how we and our associates are paid, and any potential conflicts of interest that we may have. A copy of the Financial Services Guide can be found at www.eandp.com.au. Please let us know if you would like to receive a hard copy free of charge.

Begin a conversation with an adviser who will help you achieve your wealth goals.
Fill out this expression of interest and you will be alerted when applications open later in the year.
Begin a conversation with an accountant who can help you with your self-managed super fund.
Begin a conversation with an adviser who will help you achieve your wealth goals.
Subscribe to get Insights and Ideas about trends shaping markets, industries and the economy delivered to your inbox.
Reach out and start a conversation with one of our experienced team.
Begin a conversation with one of our advisers who will help you achieve your wealth goals.
You can search for an adviser by location or name. Alternatively contact us and we will help you find an adviser to realise your goals.